By William S. Altman, Ph.D., SUNY Broome Community College
You’ve probably noticed that as scholars, we tend to do an awful lot of writing. We write articles, blog posts, and lots of other kinds of documents to communicate our thoughts or research findings. Sometimes we write to help us understand what we’re trying to learn, or to clarify our own thinking about something. But quite often, we face the daunting task of knowing HOW to get our thoughts down in some coherent way. It would be nice to find some method to make this easier and less stressful.
One possible solution is the V-diagram, originally developed by D. Bob Gowin at Cornell University. Using this format will help us to develop our thoughts, organize our ideas automatically, and see where we might need more information or better connections.
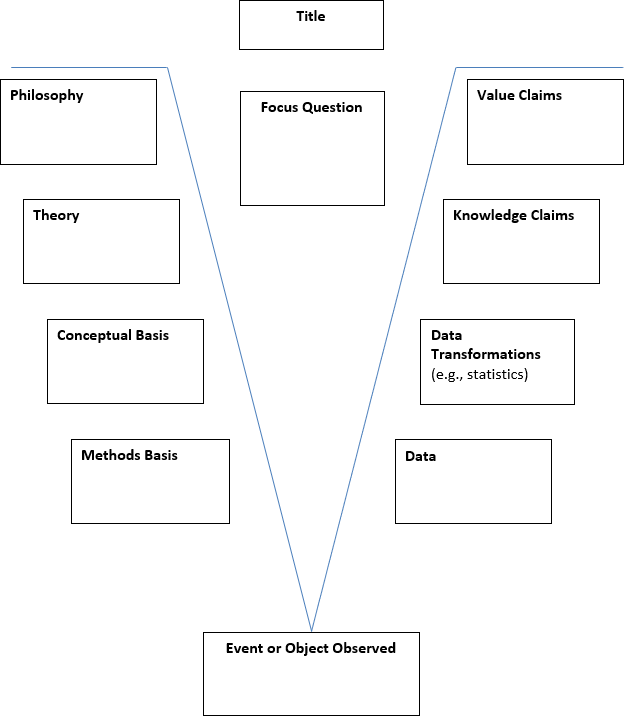
So, let’s see how using a V-diagram might help us. The sides of the diagram represent conceptual information (on the left) and data-driven information (on the right). The center of the V contains the focus question that the writer hopes to answer with their work. The actual event or object that the writer has observed is placed at the bottom of the V. In other words, once you have your focus question, you work your way down the left side to develop your experiment or observational method, and once the experiment or observation is done, you work your way up the right side to deal with the data and draw your conclusions. In general, the entries on the left and right sides will tend to mirror one another, as you’ll see in the examples below.
Here’s how the V-diagram is constructed:
Just as an example, let’s use the diagram to write about research on how to be safe when hiking in the forest.
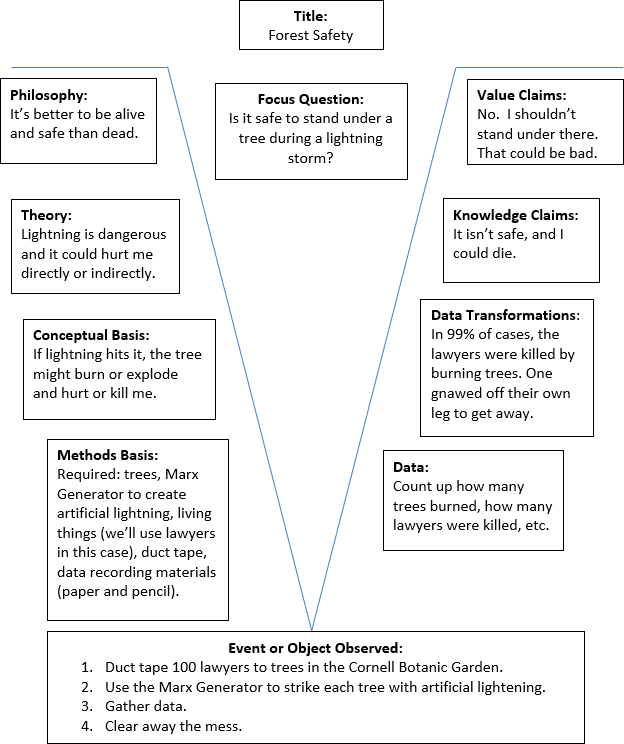
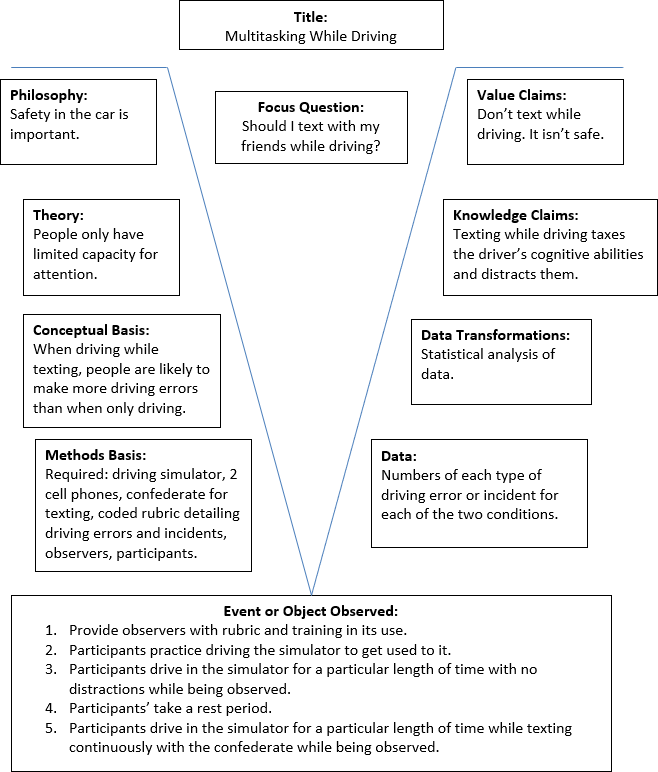
As you can see from the example above, it would be pretty easy to translate this into a finished article or book chapter. Tackling a typical psychological paper would be very much the same:
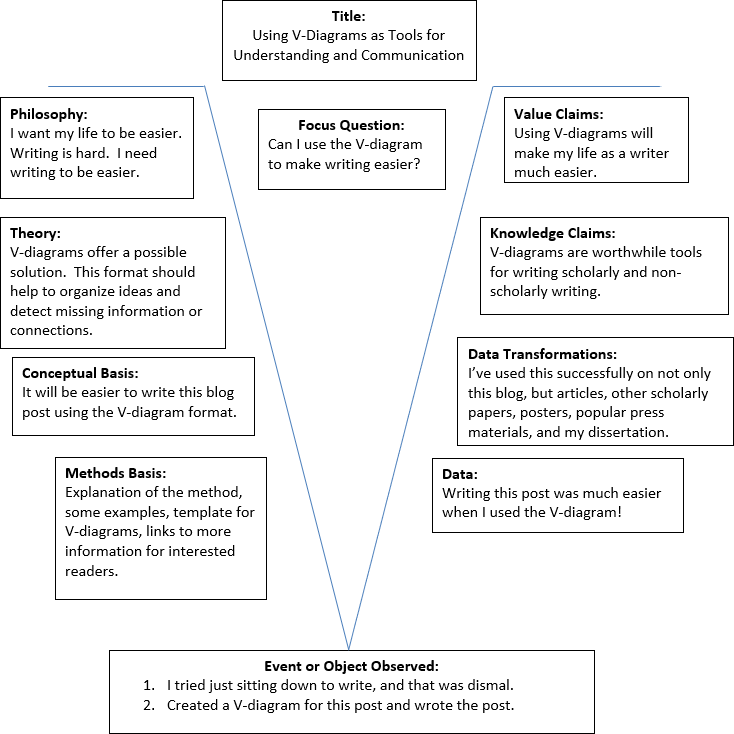
In fact, this method has been so helpful over the years, I used it to help write this piece. Here was my diagram:
So, as you can see, the V-diagram does make writing a lot simpler. I definitely encourage you to try it!
You can learn more about V-diagrams by reading Learning How to Learn (Novak & Gowin, 1984) or The Art of Educating with V Diagrams (Gowin & Alvarez, 2005), or by visiting the following websites:
References
Gowin, D. B. & Alvarez, M. C. (2005) The art of educating with V diagrams. Cambridge University Press.
Novak, J. D. & Gowin, D. B. (1984). Learning how to learn. Cambridge University Press.
William S. Altman is a professor in the Psychology and Human Services Department at SUNY Broome Community College, and currently serves as The Society for the Teaching of Psychology’s Vice President for Resources. Dr. Altman holds Ph.D. and M.S. degrees in Educational Psychology and Measurement, and an M.P.S. in Communication Arts from Cornell University, and a B.A. in History from the University of Pennsylvania. In 2018, STP honored him with the Wayne Weiten Teaching Excellence Award.
He spent over a decade sharing information about education and psychological science on local radio, been a professional photographer, and performed in theater and as a standup comic (ostensibly to work on classroom presentation skills, but mostly because it's fun).
Bill Altman is driven by a wide and unpredictable curiosity, an almost pathological and sometimes annoying need to solve problems of nearly any sort, and a sense that it all ought to be fun.
