School name:
University of California, Riverside
Type of school:
4-year public university, Hispanic Serving Institution
School locale:
Riverside, California
Classes you teach:
Before coming to UC Riverside, my teaching focused on Statistics, Research Methods, and Cognitive Psychology. Currently, I’m teaching a class on Social Identities in Development and R programming. I’m excited to teach Cognitive Development, Statistics, and Social Psychology in the near future!
Average class size:
I started out teaching smaller classes (~30). Currently, my average class size is 60, but will be teaching larger classes (100-150 students!) later this year.
What’s the best advice about teaching you’ve ever received?
I think my favorite piece of advice is “the first time you teach a class, you should aim to get through it. You will improve and perfect it the second and third time.” This particular piece of advice helped me recognize that classes don’t have to be perfect, and they can change. It has encouraged me to try new activities in my classes, reflect on what’s working and what’s not, and ask for feedback from students on their experiences in the class.
What book or article has shaped your work as a psychology teacher?
I really like Naked Statistics by Charles Wheelan. Dr. Frank Golom at Loyola University let me borrow his copy when I started teaching Research Methods. The book contains statistical explanations with a conversational tone. What really resonated with me was how the examples related to everyday topics (dating, LeBron James, and baseball). It reminds me that, while statistics tends to be anxiety provoking for students and can be regarded as “the class to avoid at all costs,” there are SO many ways to make it more approachable. For instance, I ask students to tell me their favorite TV shows and movies and structure examples around video clips. “The Office,” “New Girl,” and “Black-ish” have currently been class favorites and I have used them to demonstrate everything from research designs to ethical considerations and statistical concepts.

Briefly tell us about your favorite lecture topic or course to teach. Believe it or not, my favorite classes to teach are research methods and statistics. I like that students learn a little bit about different subdisciplines of psychology and can see how statistics are important for understanding how we think, behave, and feel. I also think they’re really important topics for students to understand because they hear about research all of the time. The news, Buzzfeed, Twitter, and even Instagram, have posts that contain statistics, and may even mislead with statistics. My goal is for students in my classes to critically consume this information and be able to talk about it.
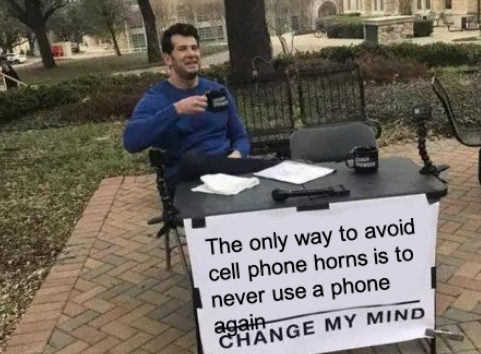
It’s a lot of fun to see students apply what they learn in research methods to these topics. For instance, I like using the example of cell phone horns in class. I ask students to read a Buzzfeed article about research investigating how “horns” develop on people’s skulls from looking at their phones too much. Then, I start off class by claiming that we all should never use our phones again and ask students to change my mind. They come up with answers pretty quickly- like investigating who funded the study, differences between correlation and causation, and questioning methods. My hope is students then take the same energy (and questions) to thinking through psychological research and other findings from the news.
Briefly describe a favorite assignment or in-class activity.
One assignment I really like is asking groups of students to “teach” a statistical concept to someone who hasn’t taken our class. Some of the students are really creative! Some use TV and Movie examples we haven’t used in class, a there have been a few interactive videos, and one group even wrote a song! The “lessons” have been used to study for finals and students seem to really enjoy it.
What teaching and learning techniques work best for you?
When I taught in person, I found that group quizzes worked really well for my research methods class. It allowed me to check student understanding both by examining the quiz grades, but also listening to the conversations students had in class. Students really worked well together, and I think their discussions helped students understand the material. For instance, most quizzes had a question about choosing the correct analysis. Because students worked in groups, they needed to justify to each other what they thought was the best approach before answering the questions. It often led to class discussions about how multiple analyses could be used, and the conditions that made one choice better than another.
What’s your workspace like? It’s a little more organized this quarter because I’m working from home and students are completing assignments virtually! My desk is usually pretty cluttered, and there’s a big window that let’s in some sun (which I love – except when I’m teaching!).
Three words that best describe your teaching style.
Approachable, inclusive, active
What is your teaching philosophy in 8 words or fewer?
Real world applications, approachable material, and student involvement
Tell us about a teaching disaster (or embarrassment) you’ve had and how you dealt with the situation.
Woof. I tried to use a class example to teach sampling distribution of the mean. I had them all write down a number from one to ten (to represent our population). Then, I gave students 30 seconds to get into groups of five (to represent sampling) and write the mean of their numbers on the board. We did a few rounds to represent that the distributions were made from every possible mean for a group of 5. Everything seemed to be going well, but then we got to the point where we needed to graph the means. I pulled up a list of means that would be graphed to highlight the complete list, and I found almost all of my students had a “deer in the headlights” look. I thought it would make more sense as we started to make a graph, but students stopped answering my questions. At this point, I was afraid that students would be terrified of any statistics that came later in the quarter.
Rather than continue the activity, I stopped and asked students to put their heads down and tell me how they were feeling (thumbs up: doing great- thumbs down: feeling lost beyond repair). After viewing a sea of thumbs down, we all discussed why students felt lost. We ended up having a good discussion about sampling strategies and how we can estimate all possible means (e.g. we can’t actually take every possible sample to find the means when we’re talking about people).
What is something your students would be surprised to learn about you?
I think my students would be surprised to hear that, while I am very excited about statistics now, I dreaded taking my first statistics course and didn't really come to embrace stats until graduate school.
What are you currently reading for pleasure?
Lately, I have been on a female comedian autobiography kick. Currently, I am reading Yes Please by Amy Poehler.
What tech tool could you not live without?
My computer and internet have been really important for teaching and for staying connected to others during quarantine. I have found myself using google docs a lot in my teaching because it lets students work together in small groups and share notes easily.
What is your hallway chatter like? What do you talk to colleagues about most (whether or not it is related to teaching/school)?
I think my hallway chatter covers a broad range. In person, I think I was equally likely to end up talking about statistics as I was to talk about family, friends, and what we did over the weekend.
